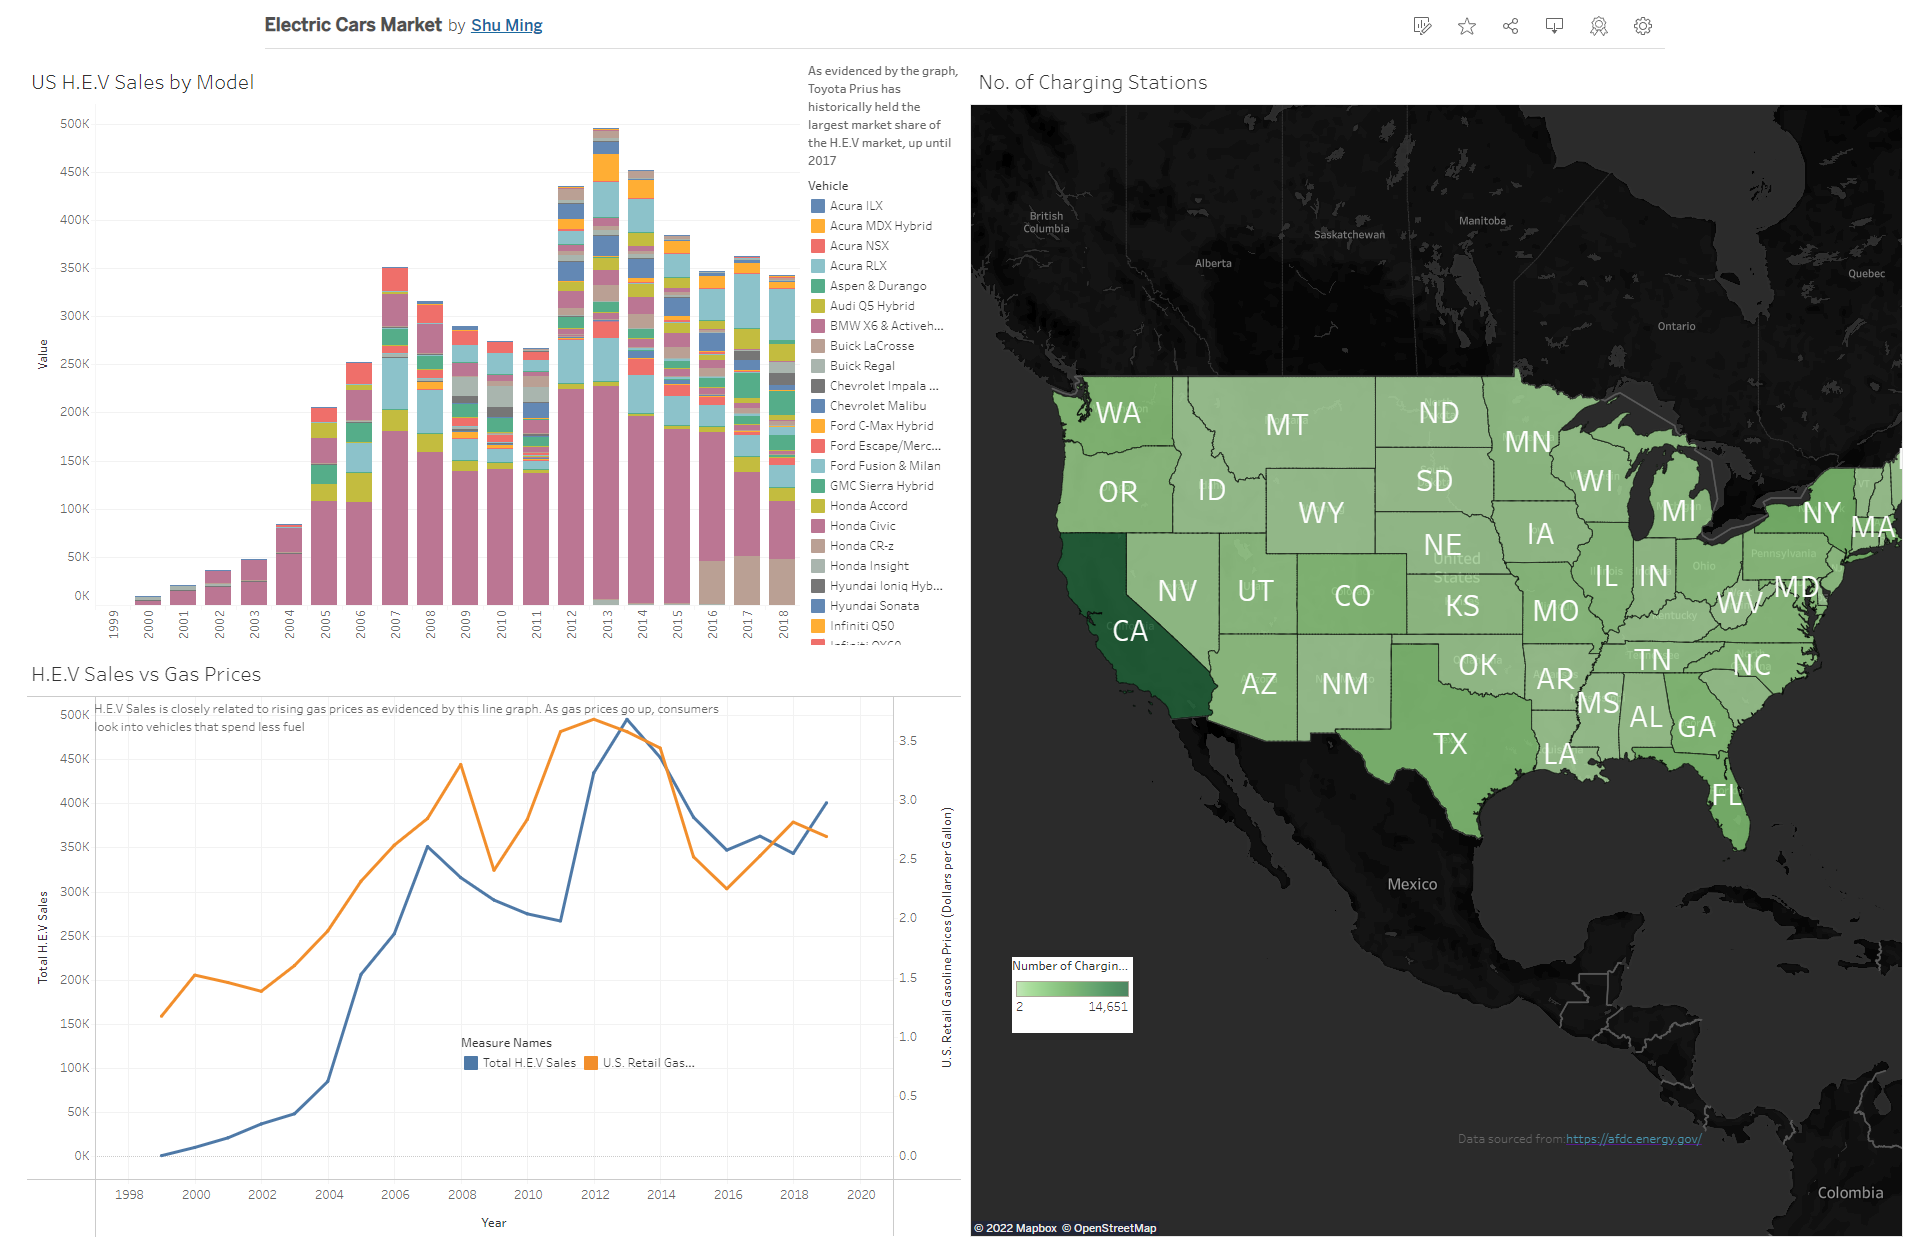
An analysis of the electric car market.
The most interesting find was that H.E.V sales were closely related to gas prices,
suggesting that the price elasticity of H.E.V sales is not the same as normal car sales.
Dataset sourced from https://afdc.energy.gov/

Data Exploration of COVID19 dataset in SQL. Demonstrates CTE, Temp tables and JOIN functions.
Dataset was sourced from https://ourworldindata.org/covid-deaths.
Covid19 Tableau Visualization
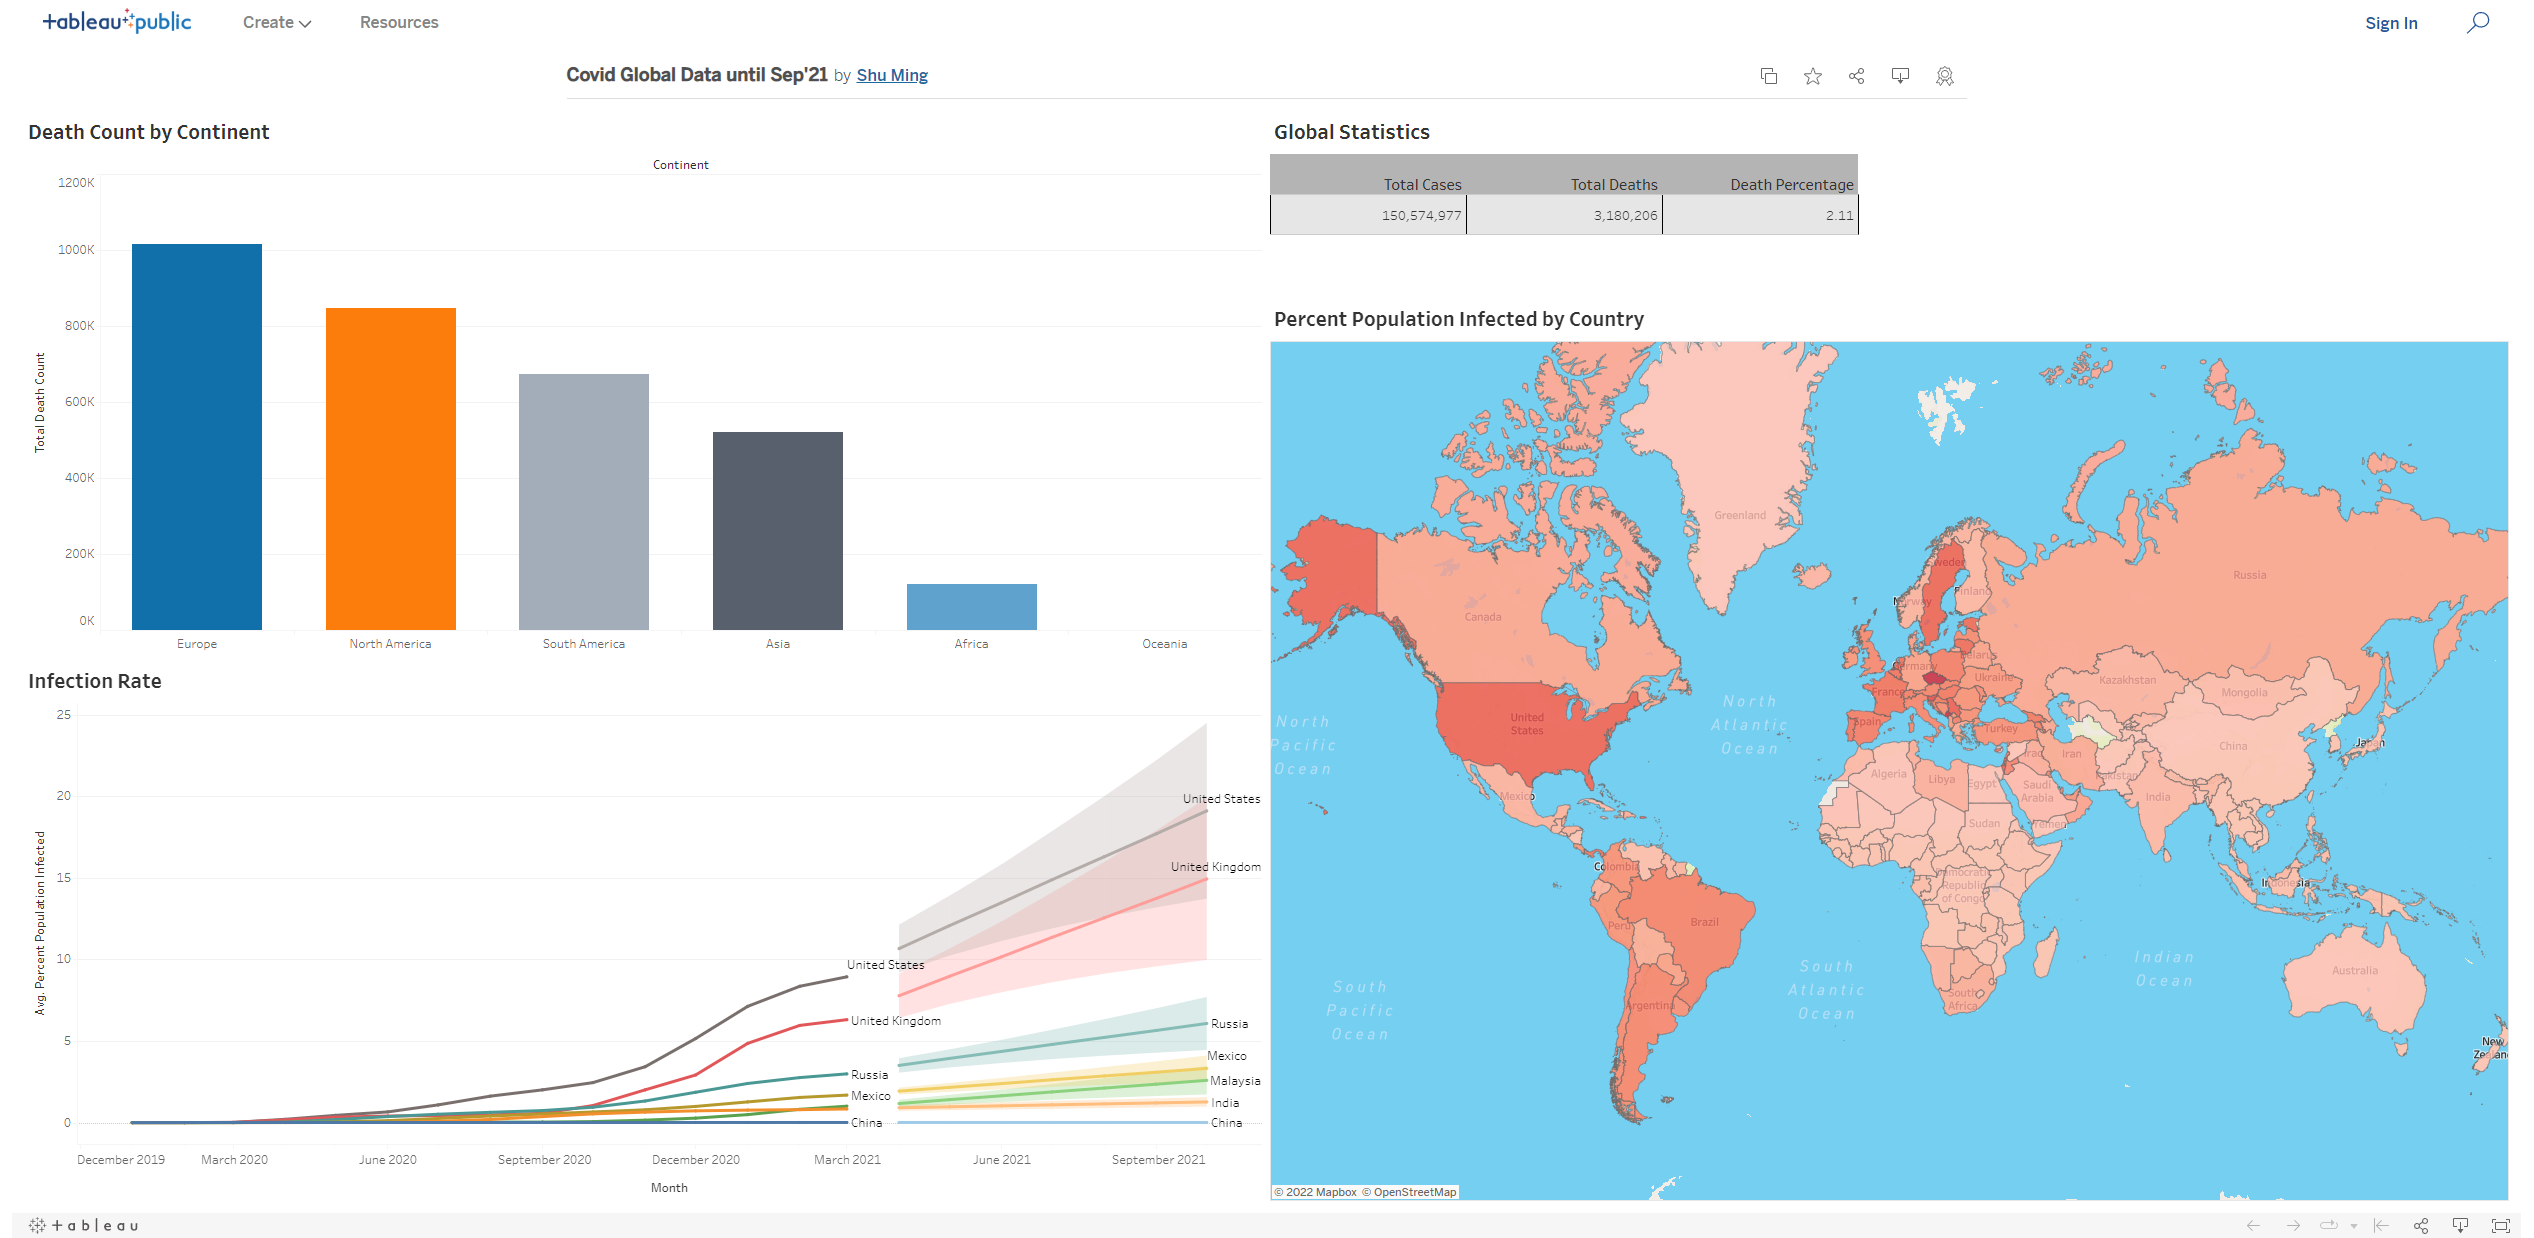
Visualization of Covid Data.
Dataset was sourced from https://ourworldindata.org/covid-deaths.
Cleaning data in SQL Queries. Standardizing date entries, populating NULL entries using JOIN, breaking down address data into individual colummns.
SQL Queries for Tableau Visualization
SQL Queries to visualize WHO data, to find a link between the productivity of a country( Gross Domestic Product Per Capita) and the severity of COVID (new cases and mortality rate).
Tableau Visualization for GDP vs Covid Metrics
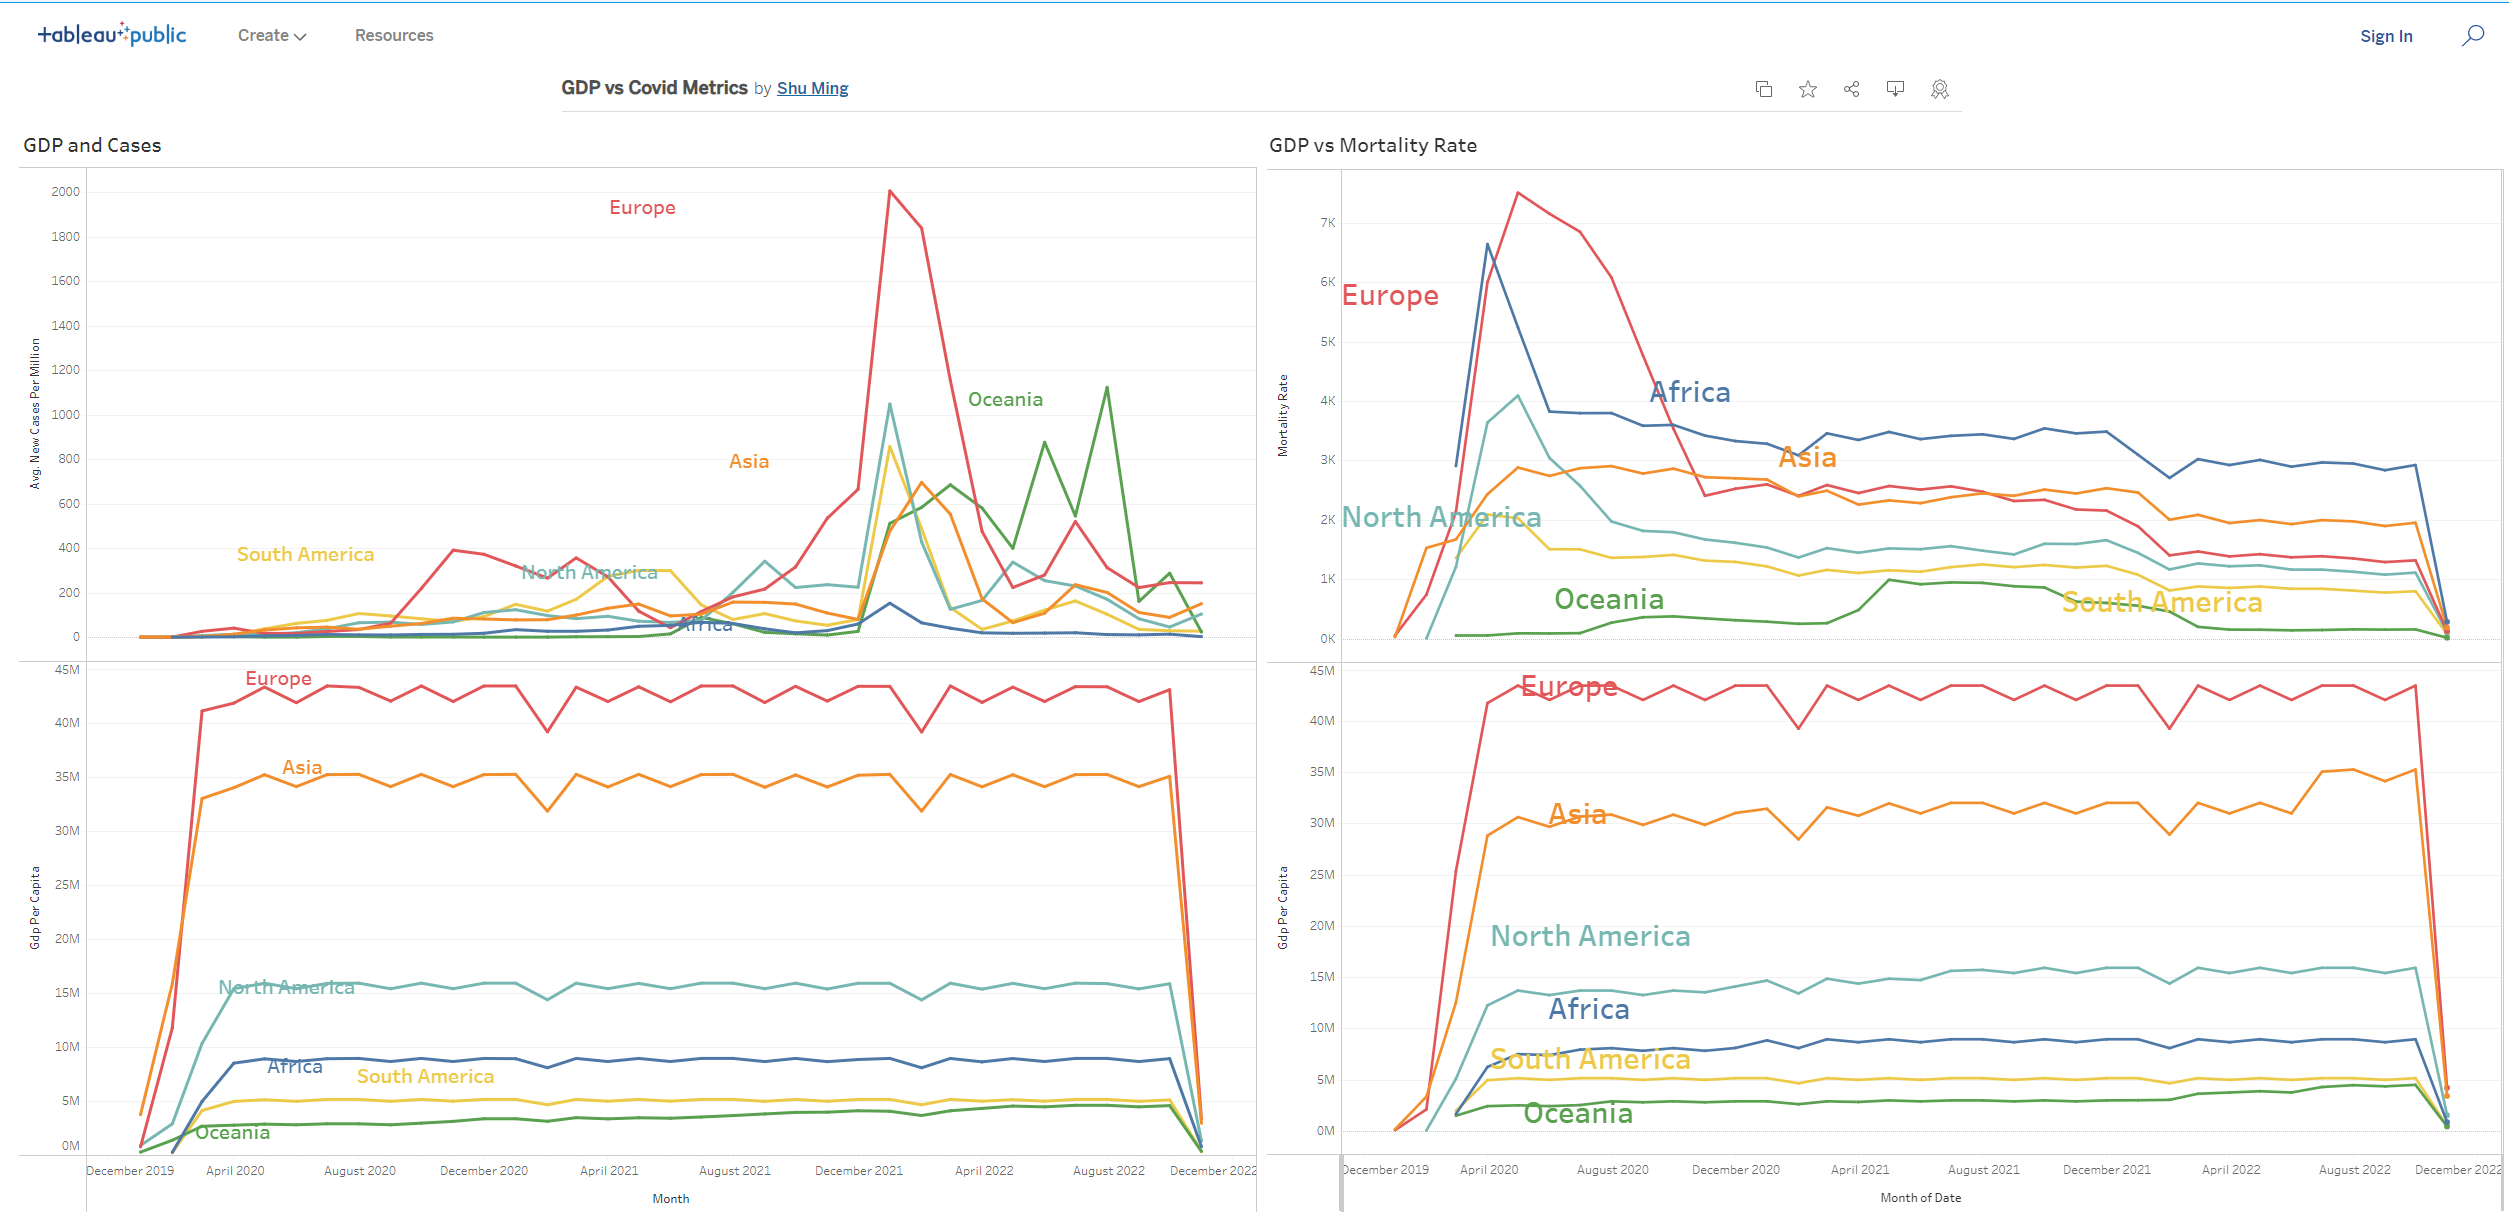
Tableau Visualization of productivity of a country( Gross Domestic Product Per Capita) and the severity of COVID (new cases and mortality rate)..
Dataset was sourced from https://ourworldindata.org/covid-deaths.